Growing Degree Days Calculator
Calculate heat and chill accumulation to predict crop development with 30 years of global NOAA data
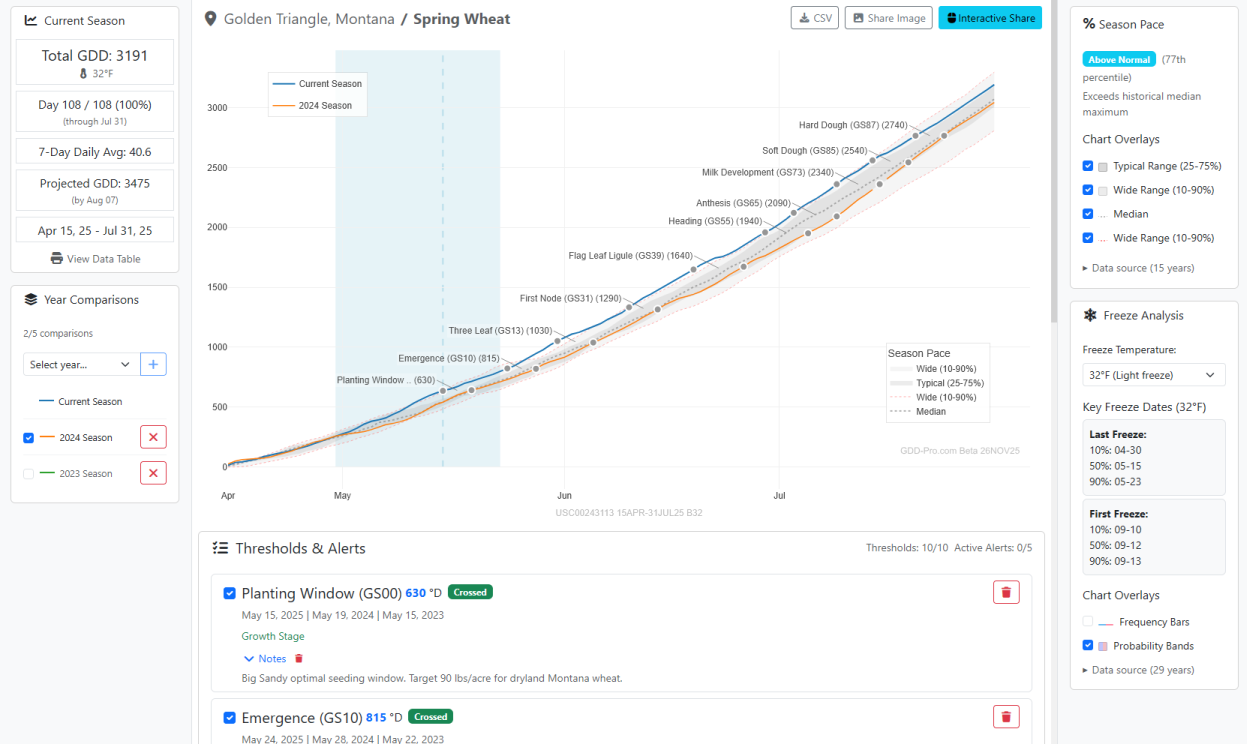
Chart View
View GDD & Chill trends and historical data
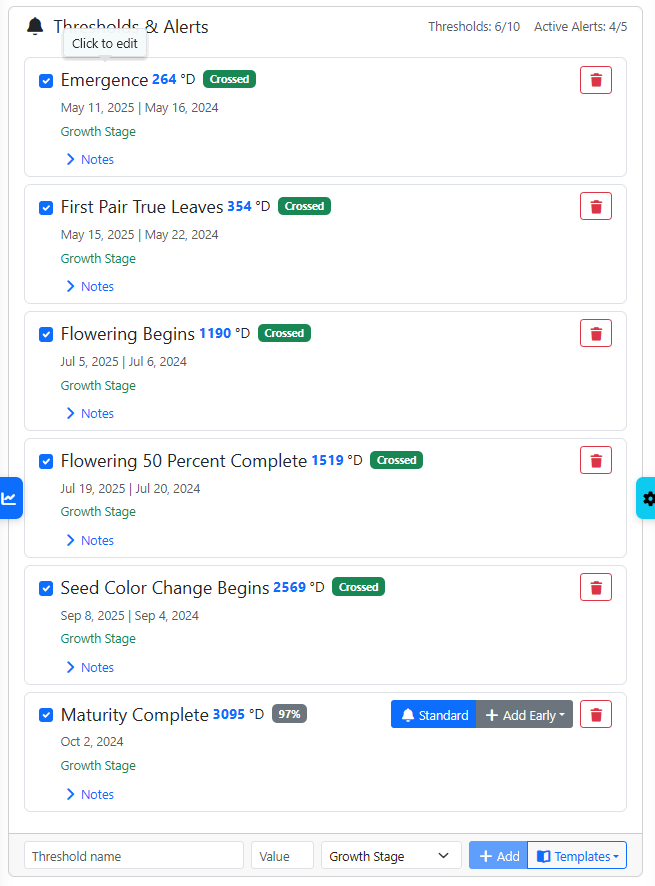
Thresholds & Alerts
Set milestones and get email alerts
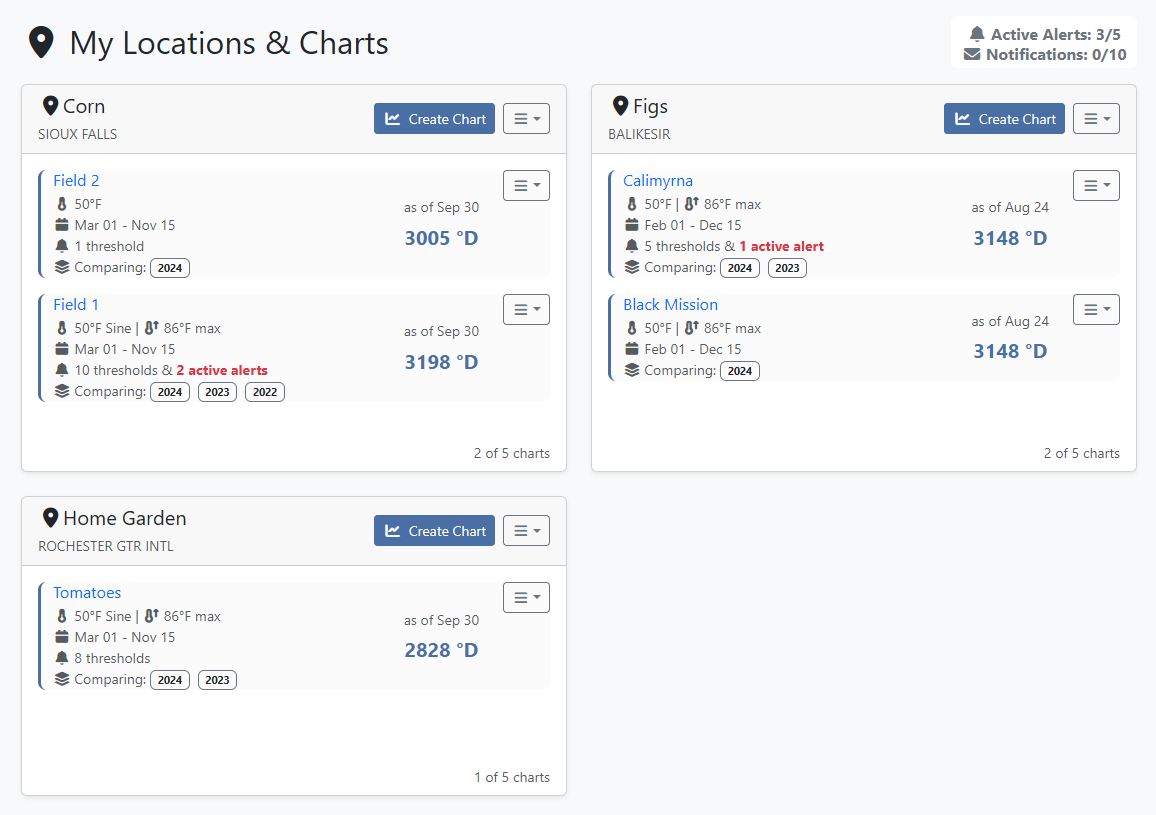
Dashboard Overview
Manage multiple locations in one place
Features & Capabilities
Global Weather
Access global 10k+ weathers stations with current season data
Basic Charts
Create GDD and Chill charts for your current growing season
Standard GDD
Growing Degree Day calculations using daily average temperatures
Modified GDD
Enhanced GDD calculations with maximum temperature capping
Sine GDD
Advanced sine curve method for more precise GDD calculations
Chill Hour Tracking
Track cold accumulation with customizable temperature ranges (32-45°F)
Regional Chill Models
Weighted chill units for temperate & warm climates - Utah, North Carolina, and blackberry models
Advanced Chill Models
Specialized models for subtropical regions and blueberries - Low Chill, Mainland, Dynamic Portions
Base Temperatures
Access to full range of base temperatures for different crops
Custom Date Ranges
Set custom start and end dates for your growing season
Multi-Year Comparison
Compare current season with previous years for trend analysis
Chart Groups
Organize charts by weather station and geographic location
Thresholds & Alerts
Set milestones and receive email notifications when reached
Early Notifications
Get advance warning when approaching GDD threshold values
Threshold Templates
Save and apply threshold lists between charts and link share with others
Season Pace
See where your GDD and Chill accumulation ranks within typical seasonal ranges
Freeze Date Tracking
Track first and last freeze dates with historical comparisons
CSV Export
Download your data for external analysis and record keeping
Image Sharing
Generate shareable chart images for reports and presentations
Interactive Chart Sharing
Share interactive charts with colleagues and advisors
Mobile Friendly
Optimized for phones, tablets, and desktops
Explore Global Coverage
Usage Limits
Chart Groups
Total number of weather stations/locations you can track
Charts per Location
Maximum number of charts you can create within each location
Thresholds per Chart
Maximum threshold milestones you can set on each chart
Comparison per Chart
Historical seasons you can overlay on each chart for comparison
Historical Lookback
How many years back in time you can access for comparisons
Threshold Templates
Maximum number of custom thresholds templates you can save
Active Alerts
Maximum number of email alerts you can have active simultaneously
Monthly Notifications
Email notifications you can receive per month from triggered alerts
Ready to Optimize Your Growing Season?
Research, plan, track, and get notified.